
PowerPoint
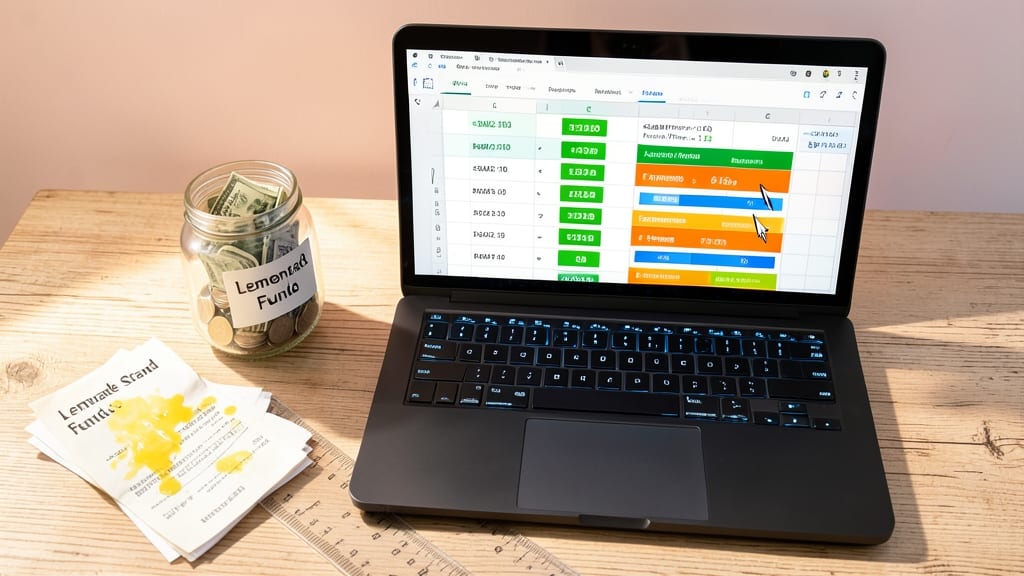
High school students can turn Microsoft Office into a powerful tool for academic success. These 10 creative projects leverage Word, Excel, PowerPoint, and Publisher to craft professional-quality work that stands out in class and beyond.
Interactive Science Fair Research Poster
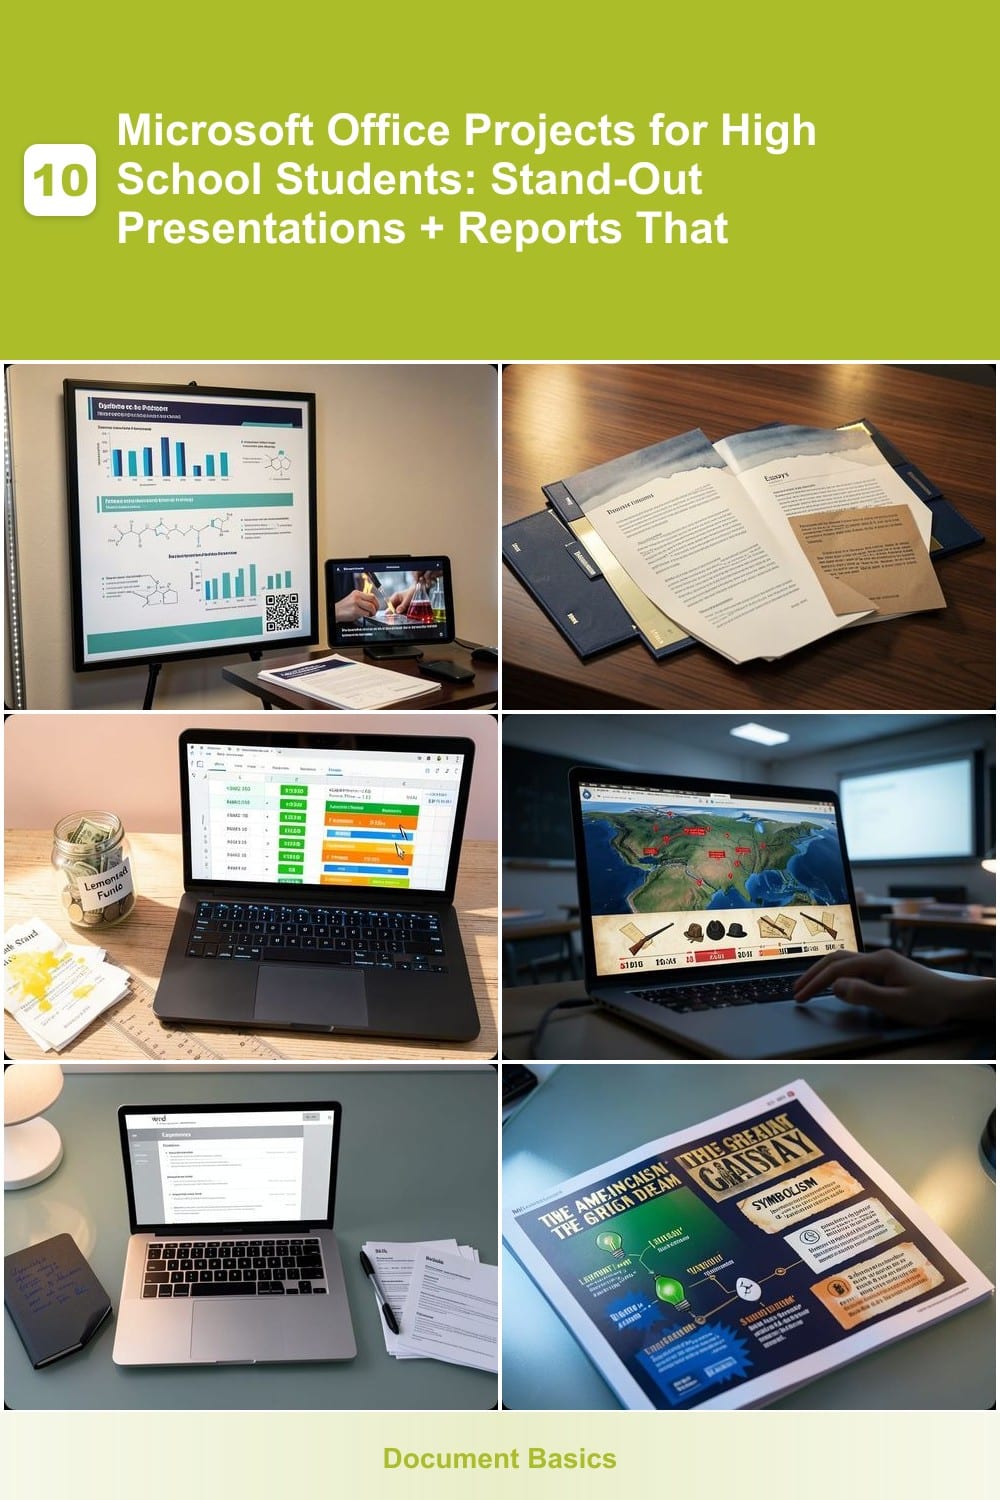
Science fairs don’t have to be static—your research can come alive with an interactive poster that blends PowerPoint’s multimedia tools with Publisher’s design polish. Instead of a one-page printout, create a digital-hybrid display where judges can scan QR codes to watch your experiment videos, click embedded charts for deeper data, and explore interactive maps of your research process.
Start by designing your poster layout in Publisher, then insert PowerPoint slides as objects to embed videos, animations, and hyperlinks. Use QR codes (generate them for free online) to link to supplementary materials like lab notes, interviews, or even a short documentary you filmed. Add SmartArt graphs to visualize results dynamically, and include a touchscreen-friendly interface if presenting digitally. The best part? You can print a high-quality version for judges while keeping the interactive elements for online sharing.
This project is perfect for visual learners, STEM fair participants, or students who want to stand out—judges remember presentations that engage multiple senses. Plus, you’ll walk away with a portfolio piece that showcases both research skills and tech savvy. ✨
Personalized College Application Portfolio
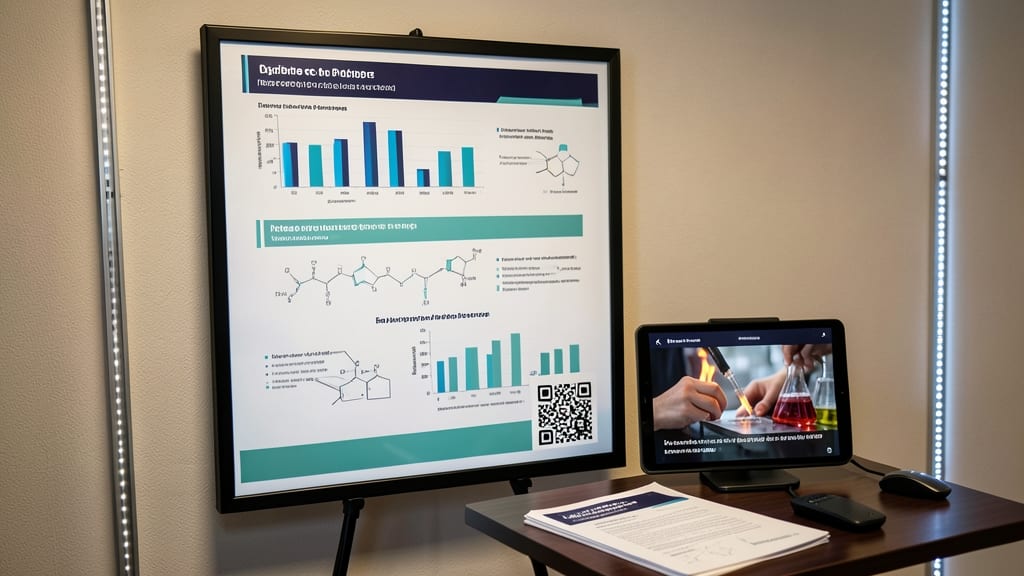
Standing out in a stack of college applications isn’t about luck—it’s about crafting a personalized portfolio that tells your story in a way admissions officers can’t ignore. With Microsoft Word and Publisher, you can design a branded, tabbed document that organizes essays, transcripts, recommendation letters, and extracurricular highlights into a cohesive, professional package—no design degree required.
Start by creating a custom letterhead in Publisher with your name, contact info, and a subtle school mascot or color scheme. Use Word’s tabs feature to separate sections like "Academic Achievements," "Extracurriculars," and "Personal Statement," then embed PDFs of awards or project photos directly into the document. Add a table of contents with hyperlinks for easy navigation, and export as a print-ready PDF or shareable digital file. Pro tip: Use Word’s built-in templates (like "Modern CV") as a starting point, then customize with Publisher’s design tools for that extra polish.
This project is a game-changer for juniors and seniors applying to competitive programs—it shows initiative, attention to detail, and professionalism. Plus, you’ll have a reusable template for scholarship applications and internships down the road. 💪
Budget Tracker Spreadsheet for Teen Entrepreneurs
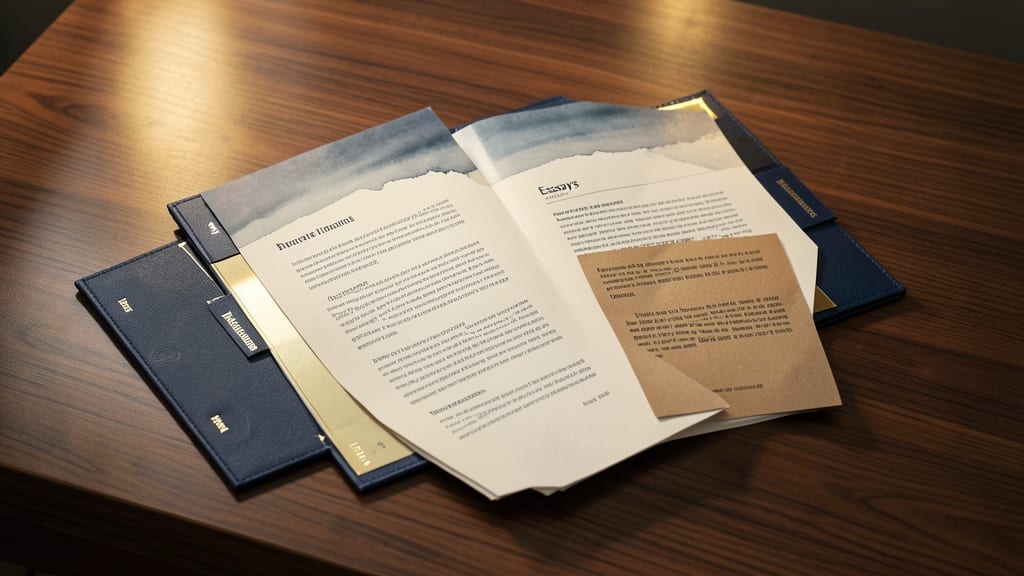
Tired of guessing where your lemonade stand money went? This Excel Budget Tracker turns financial literacy from confusing to fun—with custom formulas that automatically categorize expenses, calculate profits, and even predict future earnings. No coding required!
Start with a pre-built template featuring color-coded expense categories, real-time profit/loss graphs, and conditional formatting to flag overspending. Add your income (allowance, sales, gigs) and watch Excel handle the math—SUMIF, VLOOKUP, and PivotTables do the heavy lifting while you focus on strategy. Export your data to PowerPoint for a visual business presentation or share it with parents/teachers to showcase your entrepreneurial skills.
Perfect for business class projects, 4-H clubs, or side hustles (like tutoring or reselling), this spreadsheet teaches real-world Excel skills while keeping your wallet in check. 💻
Historical Timeline Presentation with 3D Maps
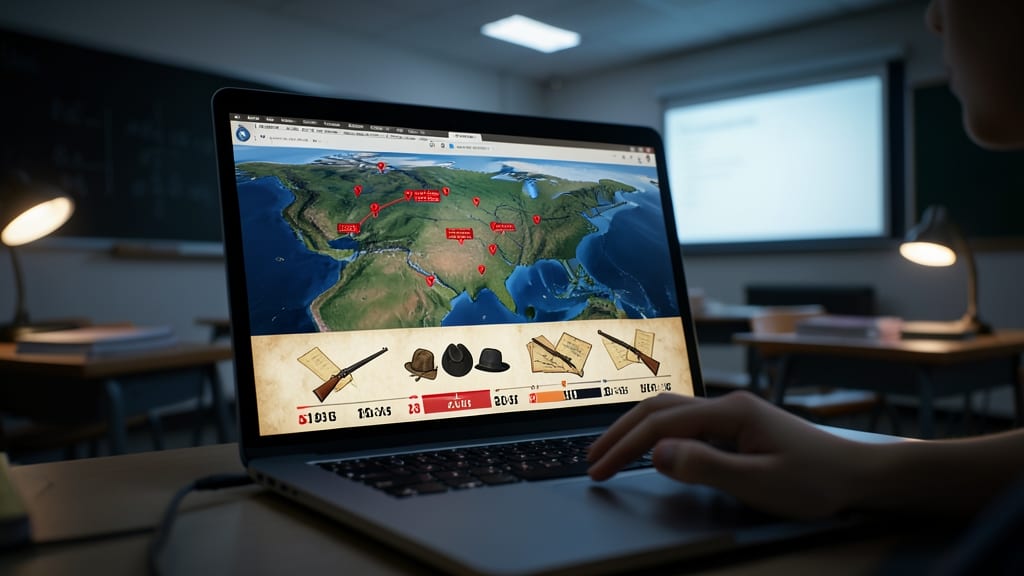
Bring history to life with a PowerPoint presentation that combines interactive 3D maps with multimedia timelines—perfect for visualizing the American Revolution or World War II. Instead of static slides, you’ll layer geographic context directly onto key events, making battles, migrations, or political shifts instantly clearer.
Start by inserting 3D map embeds (using tools like PowerPoint’s built-in map feature or third-party add-ins) to show troop movements or colonial settlements. Add animated timeline markers to highlight battles, treaties, or discoveries, then overlay period photographs, audio clips of speeches, or even short documentary videos for depth. The Morph transition feature lets you smoothly pan between maps and timelines, while hyperlinks connect related events.
This project is a game-changer for AP History students or debate teams—teachers rave about how it turns abstract concepts into engaging, memorable lessons. Plus, it’s easier than you think with PowerPoint’s pre-built templates and free map resources online. ✨
Customizable Resume and Cover Letter Template
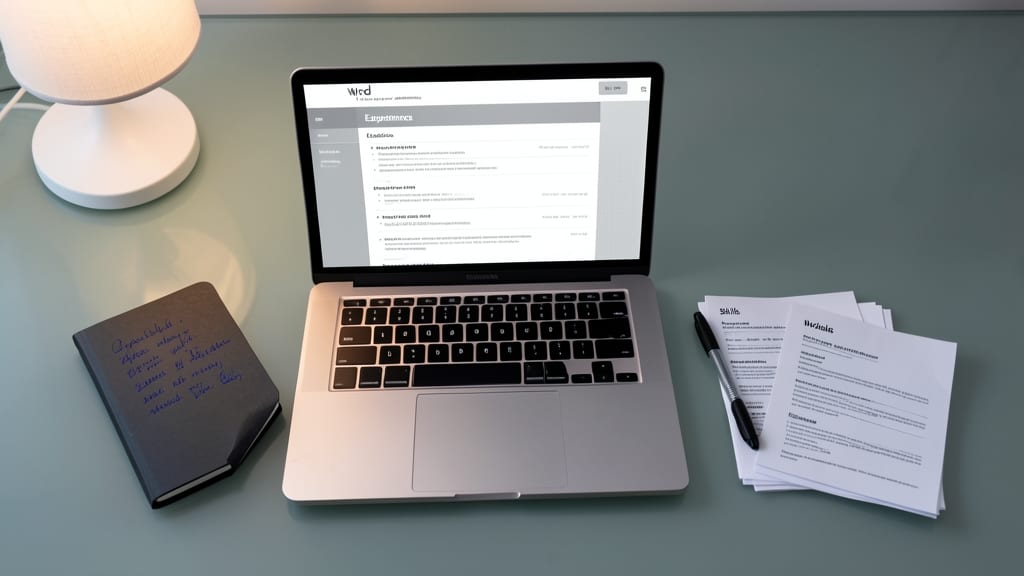
Tired of typing the same resume from scratch for every job application? This Word-based resume and cover letter template lets you create a customizable, fillable masterpiece in minutes—no design skills required. Simply download a pre-formatted template, replace the placeholder text with your achievements, and save multiple versions for different opportunities.
Use Word’s built-in content controls to toggle between sections (e.g., work experience vs. volunteer work) without rewriting everything. Add a matching cover letter template with pre-written prompts for job-specific details, then export as a PDF or Word doc for flawless formatting. The best part? You can reuse this template for internships, part-time jobs, or even college applications—just swap the details.
Perfect for career tech classes, student job seekers, or anyone building a professional portfolio. Stand out from generic applications with a polished, error-free resume that adapts to any opportunity. 💪
Literary Analysis Infographic Report
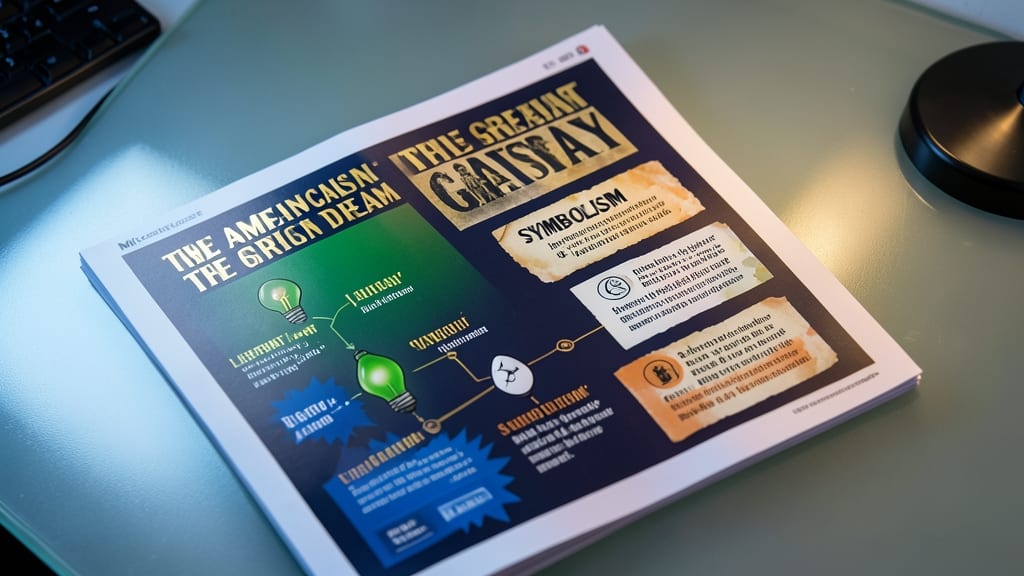
Ditch the dry book reports—your literary analysis just got a visual upgrade. With Microsoft Publisher, you can transform your deep dive into The Great Gatsby or The Raven into a stunning infographic that combines text, color, and design to highlight key themes, character arcs, and literary devices.
Start by using Word to draft your analysis, then import it into Publisher to create a multi-page layout with color-coded sections for themes (e.g., blue for love, red for conflict). Add character relationship maps with arrows and callouts, or use shape tools to highlight key quotes. The SmartArt feature lets you turn abstract concepts—like symbolism or irony—into easy-to-understand diagrams. Export as a PDF or print it as a poster for class discussions.
This project is a game-changer for English classes, especially for visual learners or students who struggle with traditional essays. Teachers will appreciate the organized, professional presentation, and you’ll finally have a way to show—not just tell—your literary analysis skills. ✨
Classroom Survey and Data Visualization

Turn raw numbers into compelling stories with this Excel survey project that lets students collect data, analyze trends, and present findings like real statisticians. Perfect for math or social studies classes, this hands-on activity transforms classroom discussions into interactive dashboards.
Start by designing a survey with 10-15 questions (multiple-choice or short answers) using Excel’s built-in templates. Distribute it digitally via Forms or print copies, then input responses into a spreadsheet. The real magic happens with pivot tables—drag and drop to create dynamic charts showing class preferences (e.g., favorite subjects, extracurricular activities) or even school-wide trends like lunch choices or study habits.
Teachers love this project because it reinforces real-world data skills while keeping students engaged. Ideal for group work or individual assignments, it’s the ultimate way to make statistics tangible and fun. ✨
Digital Yearbook with Photo Albums

Ditch the dusty photo albums—your school’s yearbook can go digital with Microsoft Publisher! This project lets you design an interactive yearbook where students can click through photo galleries, read captions, and even embed short video messages from classmates.
Use Publisher’s built-in templates for a polished layout, then add hyperlinked indexes to jump between sections. Include student spotlights with embedded photos, achievements, and quotes—all searchable. The best part? You can export it as a PDF or shareable digital file for parents and alumni to browse online.
Perfect for homeroom teachers or journalism classes, this project teaches design skills while preserving memories in a way that’s way more engaging than a printed book. ✨
Environmental Impact Calculator Tool
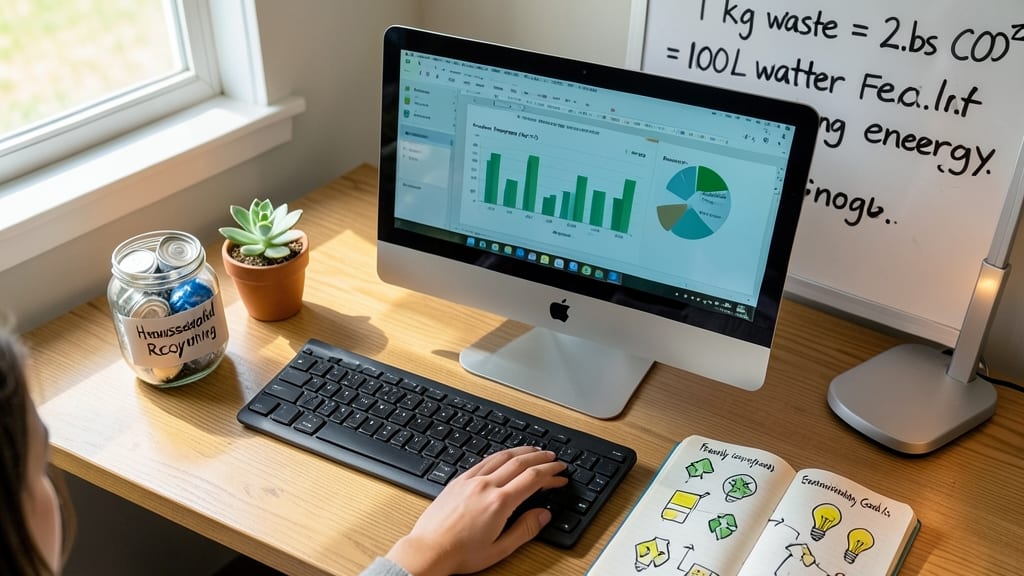
Turn your passion for sustainability into a data-driven science project with this Excel-based Environmental Impact Calculator. Instead of just discussing eco-friendly habits, you’ll quantify their real-world effects—like tracking your family’s carbon footprint, water usage, or recycling rates—with customizable formulas and visual charts.
Start by inputting daily habits (e.g., miles driven, energy use, or waste recycled) into pre-built cells. The tool automatically calculates your monthly impact and compares it to national averages using VLOOKUP functions and conditional formatting for instant insights. Add a bar graph to visualize progress over time, or use data validation to ensure accurate inputs—no coding required!
Perfect for science fairs, environmental clubs, or group presentations, this project teaches real-world Excel skills while making sustainability tangible. Teachers love it because it blends math, research, and activism into one interactive tool. 🌟
Interactive Book Report with Audio Narration

Turn book reports from boring to immersive with a PowerPoint project that blends text, audio, and visuals. Instead of just writing about a book, you can record your own narration, add character interviews (even if they’re just your voice acting!), and sprinkle in animations to bring scenes to life.
Start by recording your summary and key analysis as audio clips, then embed them directly into slides. Use PowerPoint’s Morph transitions to animate character movements or scene changes—think a slow zoom-in on a book’s cover when discussing themes. For reluctant readers, this project makes analysis feel dynamic and personal, while strong readers can flex their creativity with themed color schemes or even simple stop-motion-style animations.
Perfect for English classes or book clubs, this project lets students showcase deep thinking without overwhelming them with text. Teachers will love the multi-sensory approach—and you’ll stand out from the crowd with a presentation that’s as engaging as the book itself. ✨