
Coding
Excel’s math and trig functions unlock powerful data analysis capabilities. These 10 essential formulas will transform raw numbers into actionable insights, from financial modeling to scientific calculations—perfect for data analysts at any level.
SUM Function for Basic Data Aggregation

Need to add up sales figures, inventory counts, or monthly expenses in seconds? The SUM function is Excel’s most versatile tool for basic data aggregation, handling everything from simple ranges to complex multi-cell totals.
Type =SUM(range)—replace "range" with your data (e.g., =SUM(A1:A10))—and Excel instantly calculates the total. For non-contiguous cells, use =SUM(A1:C5, H1:H10). It even ignores empty cells and text, making it foolproof for messy datasets. Pro tip: Press Alt + = to auto-sum selected cells instantly.
Perfect for accountants, small business owners, or anyone managing budgets, this function saves hours of manual addition. Start with it, and you’ll master Excel’s math power in no time. ✨
AVERAGE Function for Statistical Analysis
When your dataset needs more than just totals—when you’re tracking quality control metrics or evaluating employee performance—Excel’s AVERAGE function becomes your secret weapon. Unlike SUM, which adds values, AVERAGE calculates the mean, revealing trends hidden in raw numbers.
Simply type =AVERAGE(range) to instantly compute the central tendency of any dataset. Need to exclude outliers? Combine it with IF or FILTER functions for refined analysis. Works seamlessly with arrays or named ranges, and handles up to 255 arguments—perfect for large-scale evaluations.
Ideal for manufacturing QA teams, HR analysts, or financial planners, this function turns numbers into insights without complex coding. ⚡
SIN and COS Functions for Engineering Calculations

When your work involves waveforms, structural loads, or circular motion, Excel’s SIN and COS functions become your secret weapon. These trigonometric tools don’t just calculate angles—they model real-world phenomena like sound waves, bridge stress analysis, or even solar panel orientation angles.
Use =SIN(angle) to compute the ratio of a right triangle’s opposite side to its hypotenuse (radians required!), or =COS(angle) for adjacent/hypotenuse ratios. For example, a civil engineer could calculate load distribution on a curved beam by combining these with PI() and POWER() functions. Excel’s built-in radians-to-degrees conversion via =RADIANS(degrees) ensures accuracy across disciplines.
Perfect for architects designing domed structures or physicists analyzing harmonic motion, these functions integrate seamlessly with Excel’s chart tools to visualize periodic data dynamically. 💡
PI Function for Circular Geometry Calculations

Tired of manually calculating circle dimensions in Excel? The PI() function is your secret weapon for circular geometry, handling everything from area and circumference to volume calculations with zero effort.
Simply type =PI() to get the precise value of π (3.14159265358979...), then multiply by radius² for area or 2 × radius for circumference. For 3D projects, combine it with POWER() to calculate cylinder volumes—perfect for piping systems or architectural columns. The function even works in radians mode for advanced trigonometric workflows.
Architects sketching floor plans, engineers designing machinery, or manufacturers planning circular components will find this the fastest way to avoid manual errors. No more guessing—just plug in your measurements and let Excel do the math. ✨
ROUND Function for Clean Data Presentation
Tired of messy decimal places ruining your polished reports? The ROUND function in Excel is your secret weapon for presenting numbers with flawless precision—whether you're formatting financial statements or scientific datasets.
Simply type =ROUND(number, num_digits) to control decimal places, and Excel handles the rest. For example, =ROUND(3.14159, 2) neatly displays 3.14, while =ROUND(123.456, -1) rounds to 120. The function even supports negative numbers and works with cell references for dynamic updates.
Perfect for accountants, data analysts, or researchers who need to maintain consistency across reports—no more rounding errors skewing your professional outputs. ✨
POWER Function for Exponential Growth Analysis

Tired of manually calculating compound growth rates or viral trend projections? The POWER function in Excel automates exponential calculations with just two inputs—base and exponent—making it a game-changer for data-driven fields.
With syntax like =POWER(base, exponent), you can model anything from bacterial population growth to social media engagement curves. For example, =POWER(1.05, 12) instantly calculates a 5% annual return over 12 months. Combine it with other functions (like FV for future value) to build dynamic financial models without coding.
This is the go-to tool for economists predicting GDP growth, biologists tracking species expansion, or marketers forecasting viral campaigns. ⚡
FACT Function for Combinatorics and Probability

When crunching numbers for probability models or combinatorial problems, Excel’s FACT function is your secret weapon. It instantly calculates factorials—critical for permutations, binomial coefficients, or statistical distributions—saving hours of manual computation.
The FACT function handles values up to 170! (factorial of 170) with precision, and pairs seamlessly with PERMUT or COMBIN functions. For example, =FACT(5) returns 120, while =FACT(10)/FACT(5)*FACT(5) calculates combinations (252). It’s also the backbone of Poisson distributions or Monte Carlo simulations in Excel.
Statisticians and data scientists rely on it for hypothesis testing or game theory models, while researchers use it to validate complex calculations. ⚡
RADIANS and DEGREES Functions for Unit Conversion

Global engineering projects demand precision—especially when datasets mix degrees and radians. The RADIANS and DEGREES functions in Excel bridge this gap instantly, converting between the two unit systems with zero risk of manual errors.
Simply wrap your angle value in RADIANS(degrees) or DEGREES(radians)—Excel handles the conversion automatically. For example, RADIANS(90) converts 90° to 1.5708 radians, while DEGREES(π/2) returns 90°. This is a game-changer for aerospace engineers, surveyors, or anyone working with CAD software that defaults to radians.
Ideal for cross-border collaboration or legacy system integration, these functions ensure your calculations align with global standards—no more lost hours reconciling unit discrepancies. ✨
ATAN2 Function for Polar Coordinate Calculations
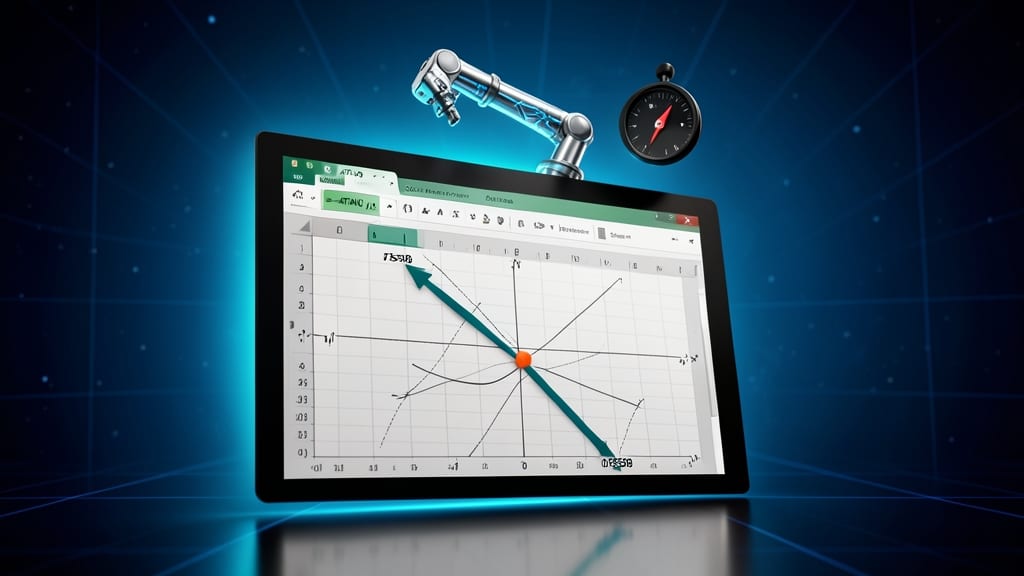
Need to convert Cartesian (x,y) coordinates into precise angles for robotics, navigation, or physics simulations? The ATAN2 function in Excel solves this with a single formula—unlike basic ATAN, it accounts for quadrant placement, giving you accurate results between -π and π radians (or -180° to 180°).
Simply input ATAN2(y,x), and Excel calculates the angle from the positive x-axis, handling all edge cases (like negative coordinates) automatically. This makes it perfect for polar coordinate conversions, trajectory modeling, or even game development where direction matters.
Robotics engineers and physicists rely on ATAN2 for real-world accuracy, while data analysts can use it to visualize vectors in Excel charts. Try it with =ATAN2(B2,A2) for instant angle calculations! ✨
LOG and LOG10 Functions for Scientific Data
Working with pH levels, sound intensity, or bacterial growth rates? Excel’s LOG and LOG10 functions are your go-to tools for handling logarithmic scales—no calculator required. These functions transform exponential data into manageable linear values, making complex scientific measurements as simple as typing a formula.
The LOG function uses the natural logarithm (base e), while LOG10 uses base 10—critical for decibel calculations (e.g., =LOG10(A2/1e-12) converts sound pressure to decibels) or pH values (e.g., =-LOG10([H+])). Both functions handle negative numbers and work seamlessly with array formulas for batch processing. For chemists, they simplify molarity calculations, while biologists use them to model population dynamics or drug concentration decay.
Perfect for lab technicians, acoustics engineers, or environmental scientists, these functions turn raw logarithmic data into clear, actionable insights—no more manual log tables or guesswork. 💡